By clicking “Accept All Cookies”, you agree to the storing of cookies on your device to enhance site navigation, analyze site usage, and assist in our marketing efforts. View our Privacy Policy for more information.
How do finance teams operate in a world, where fast data-driven decision-making is key?
Many CFOs realise that spreadsheet tools like Excel are no longer the answer to that question. More time is spent crunching numbers than extracting valuable insights and acting on them.
Pectus enables finance teams to access available data easily and to collaborate efficiently, while providing modern ways to analyse and plan.
One table to rule them all
At Pectus everyone knew that working with numbers is inherently bound to using some sort of spreadsheet or table.
Of course, we wanted to innovate, but we also knew that developing a radical new concept could take a long time. Time, that we didn’t have since the strategy demanded to make the product sales-ready to gain traction before the upcoming fundraise.
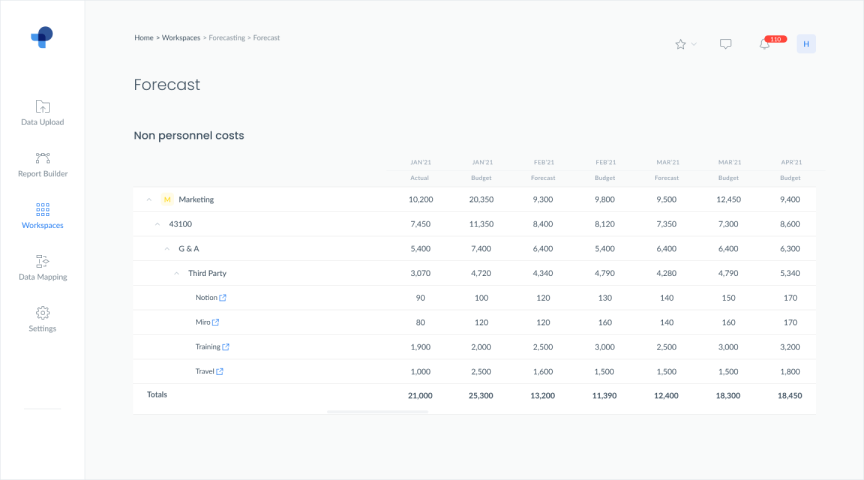
Forecasting table
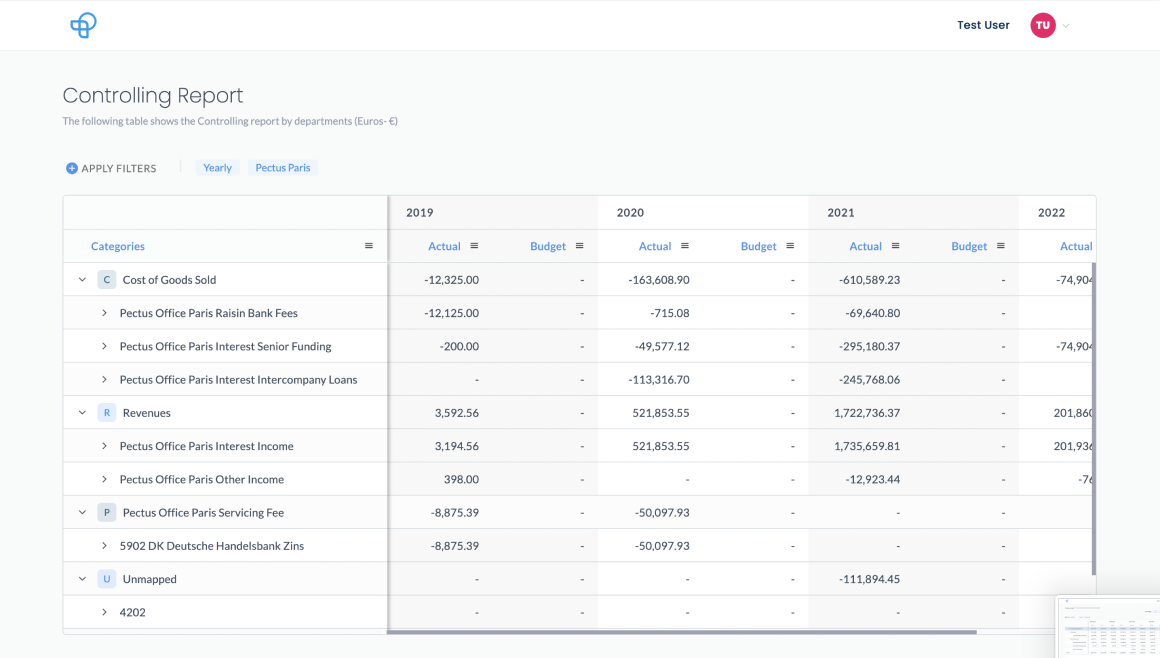
Analysis table
There had already been made an effort to build tables in each one of our product teams for both analysis and planning. Their previous way of working with freelancers resulted in a fragmented UI and a confusing experience due to complex information architecture.
While they already addressed user pain points, it became clear that building two tables was not a feasible approach. After taking inventory of the status-quo and deep internal discussions, we decided to redesign the table component in order to craft a re-usable component and to offer a coherent experience.
Aligning on requirements
To kickstart the process, the design lead and I talked to stakeholders, gathered requirements and took time to understand what role the table takes within the application.
In short, the table needed to provide our users an easy way to build standard statements (P&L, Cashflow, Balancesheet) and allowing easy input of their ingested data.
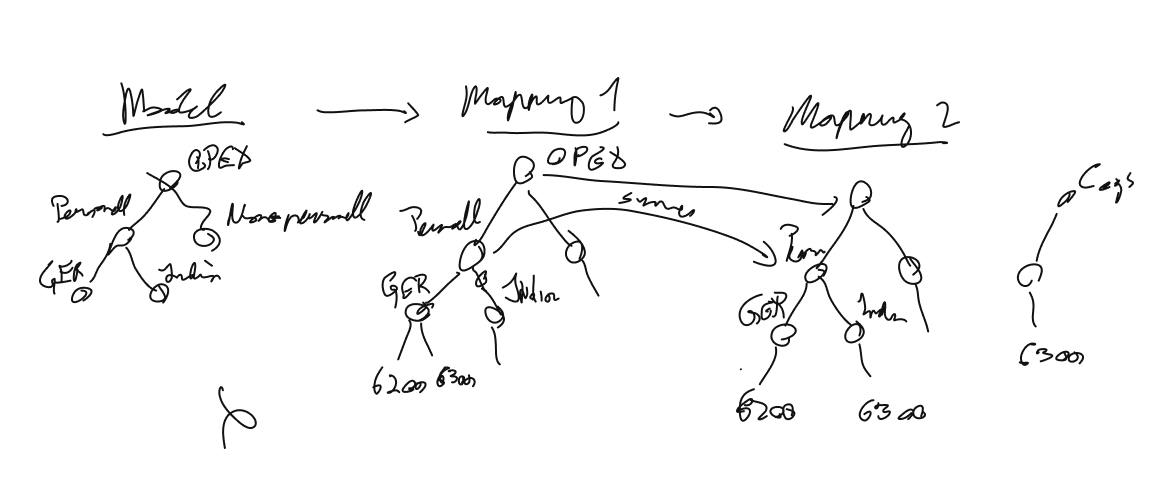
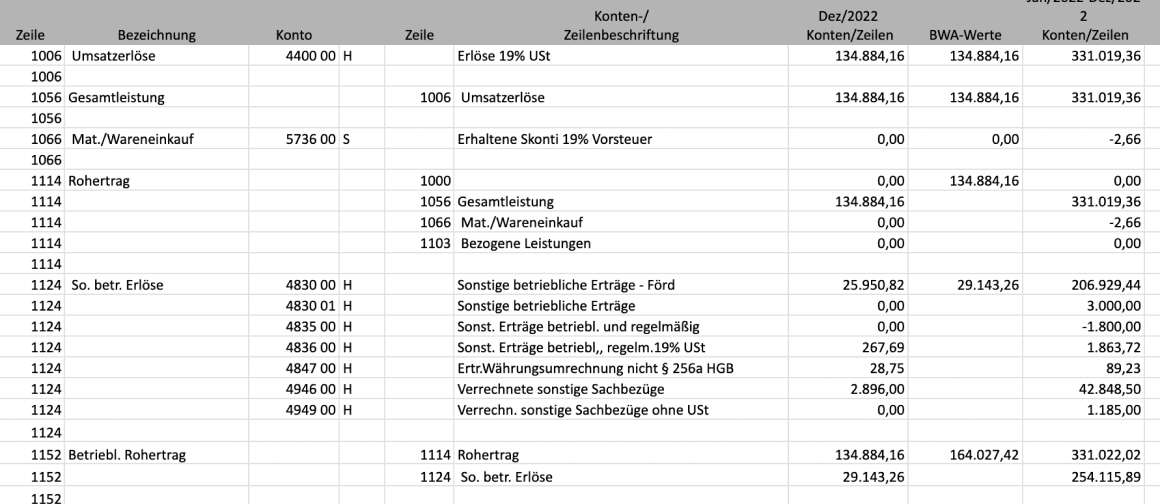
Data processing
Data structure
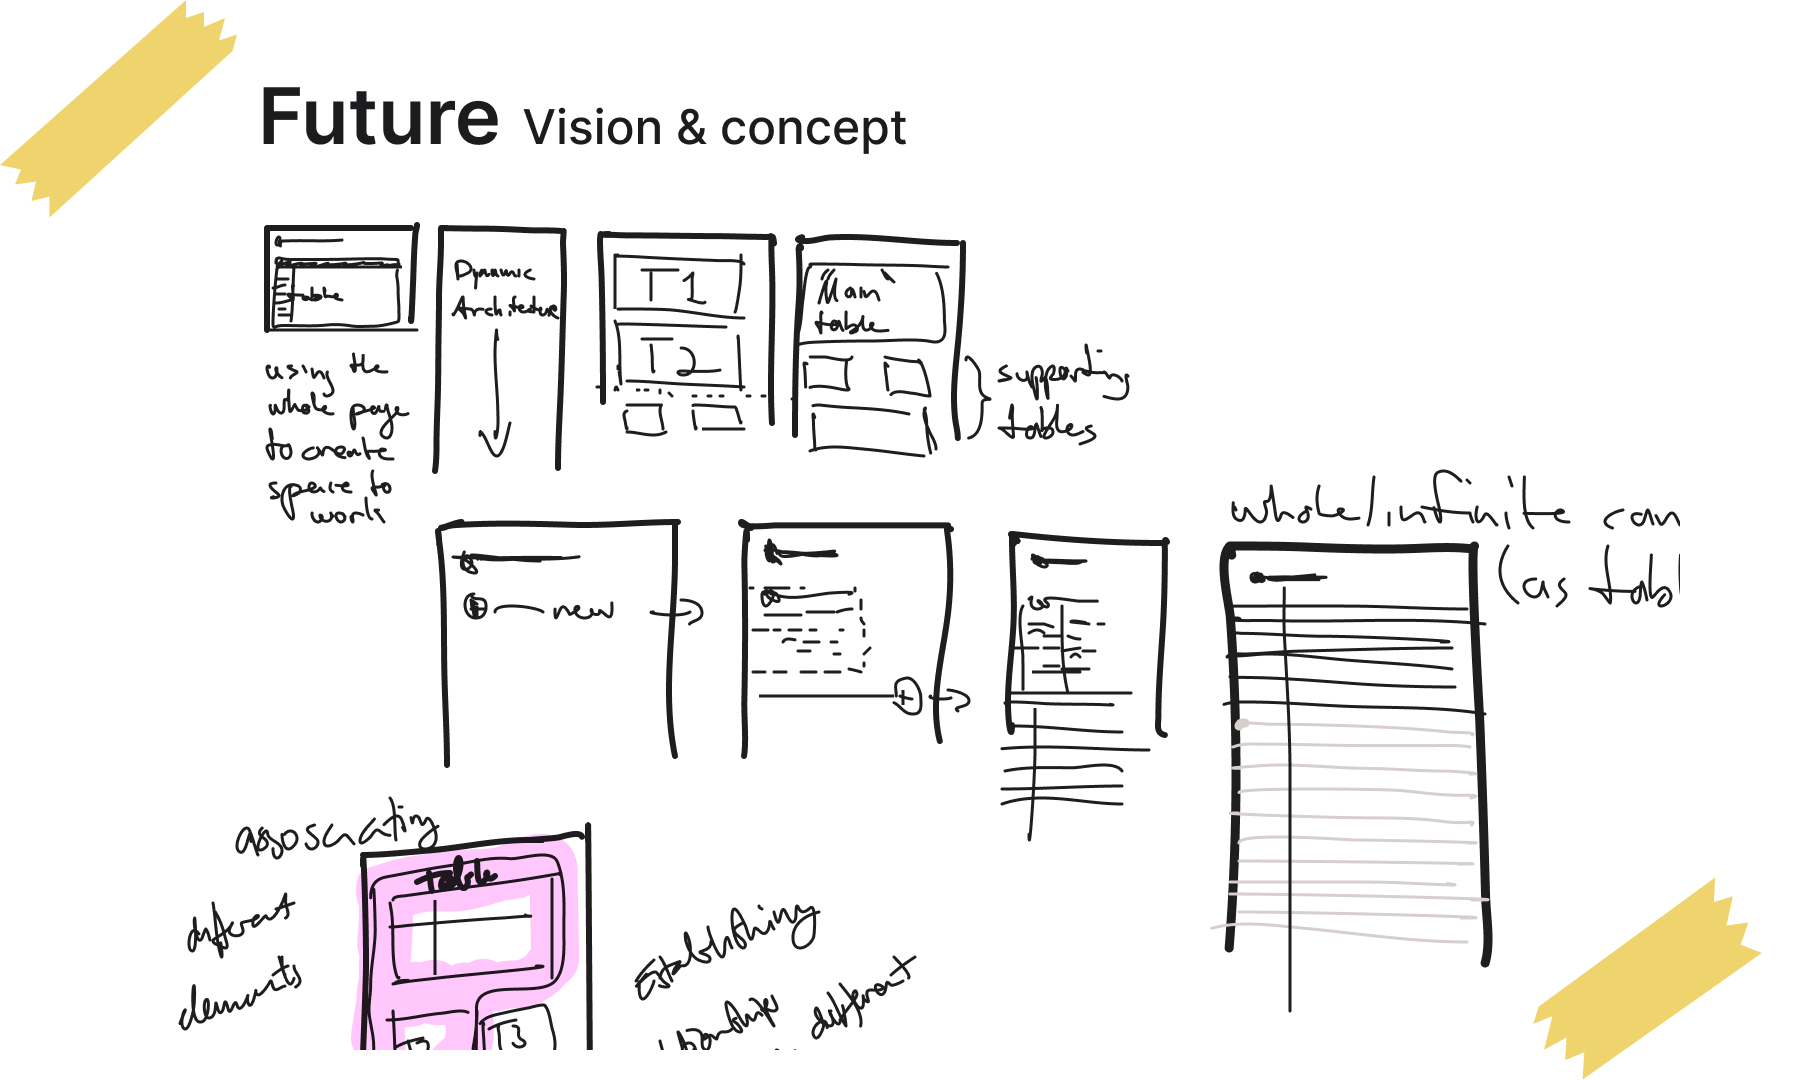
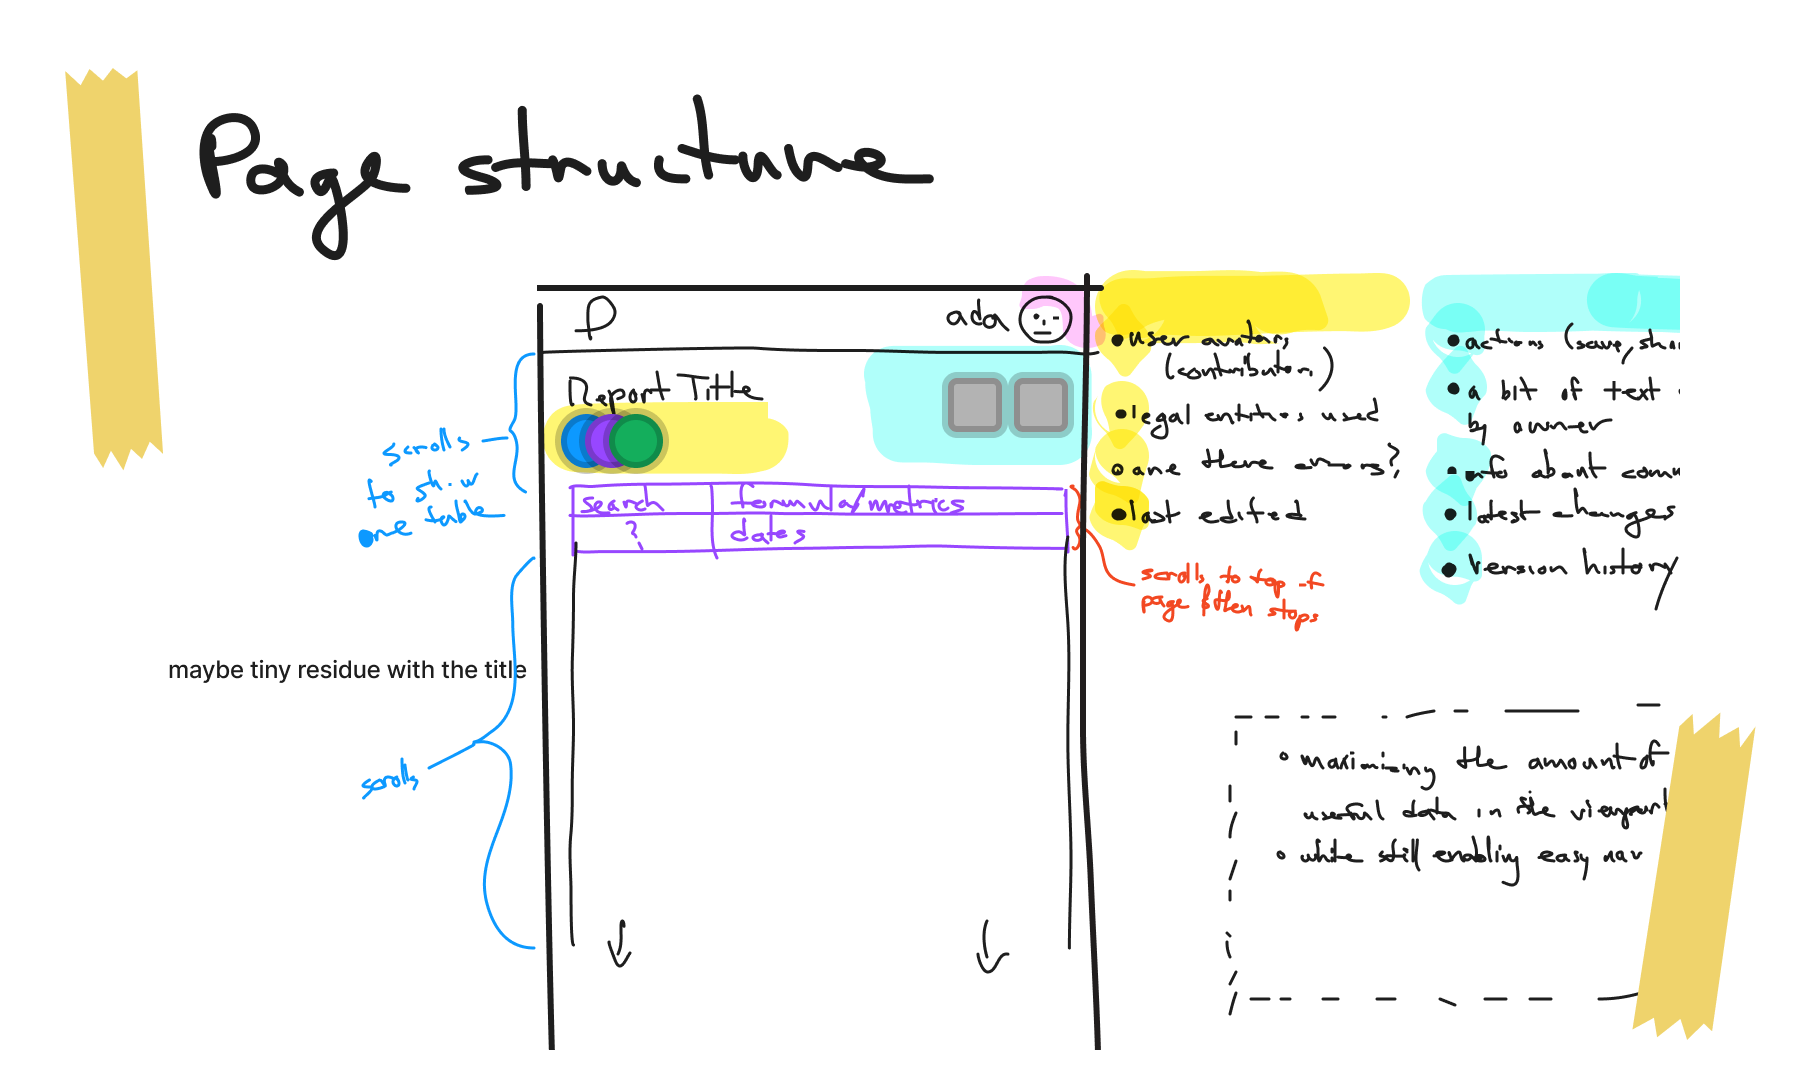
Wireframing & Sketching
Then, we had several sessions to digitally sketch and to have conversations around initial wireframes and concepts.
Building on the work of our team and what we’ve learned from talking to our development partners, our approach was to design a table that
respects existing UI patterns of spreadsheets and is easy to operate
can be build upon later as we learn more and add complexity
explicitly caters to the needs of finance professionals.
Since the table is such an information dense component, it was challenging to arrive at a comprehensive interaction design. Especially when trying to keep the user’s cognitive load low and space for affordances is limited.
Prototyping
Together with our product manager, we worked out the scope of the first two versions of the table. I created a prototype to gather input from our team and reach common understanding and alignment amongst us of what we’re building.
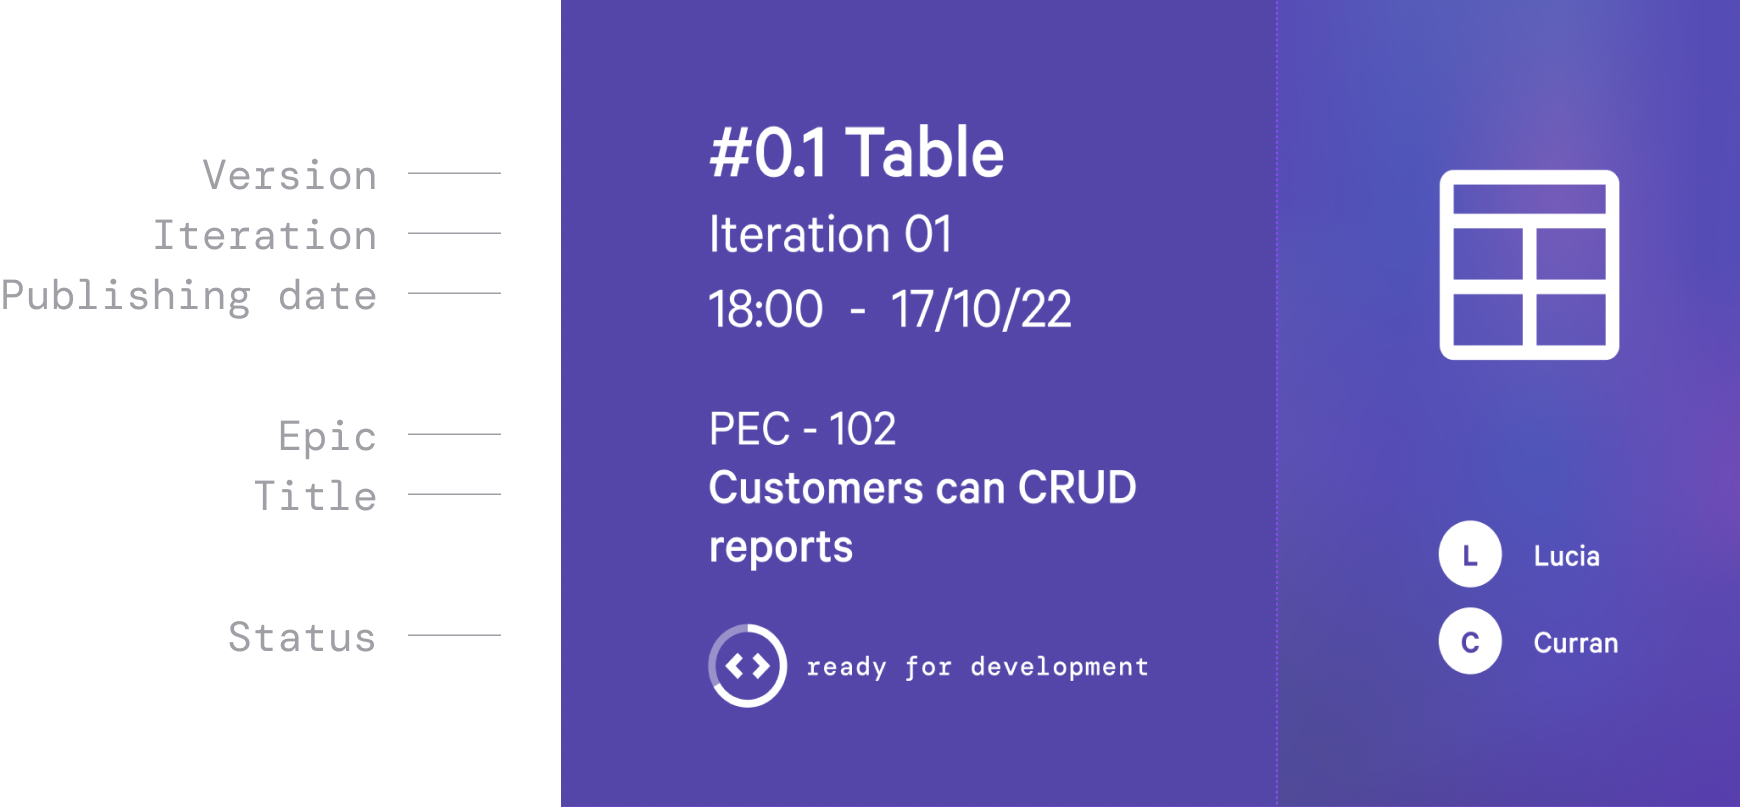
Preparing for handoff
Moving towards development, I conceptualised a new file structure in Figma to simplify hand-off and organise our resources.
By referencing epics and user stories from Jira, creating a space for discussions between engineering and design and documenting changes in a structured way, we were able to reduce misalignment.
File cover showing the file structure in Figma
Specs inside a hand-off file
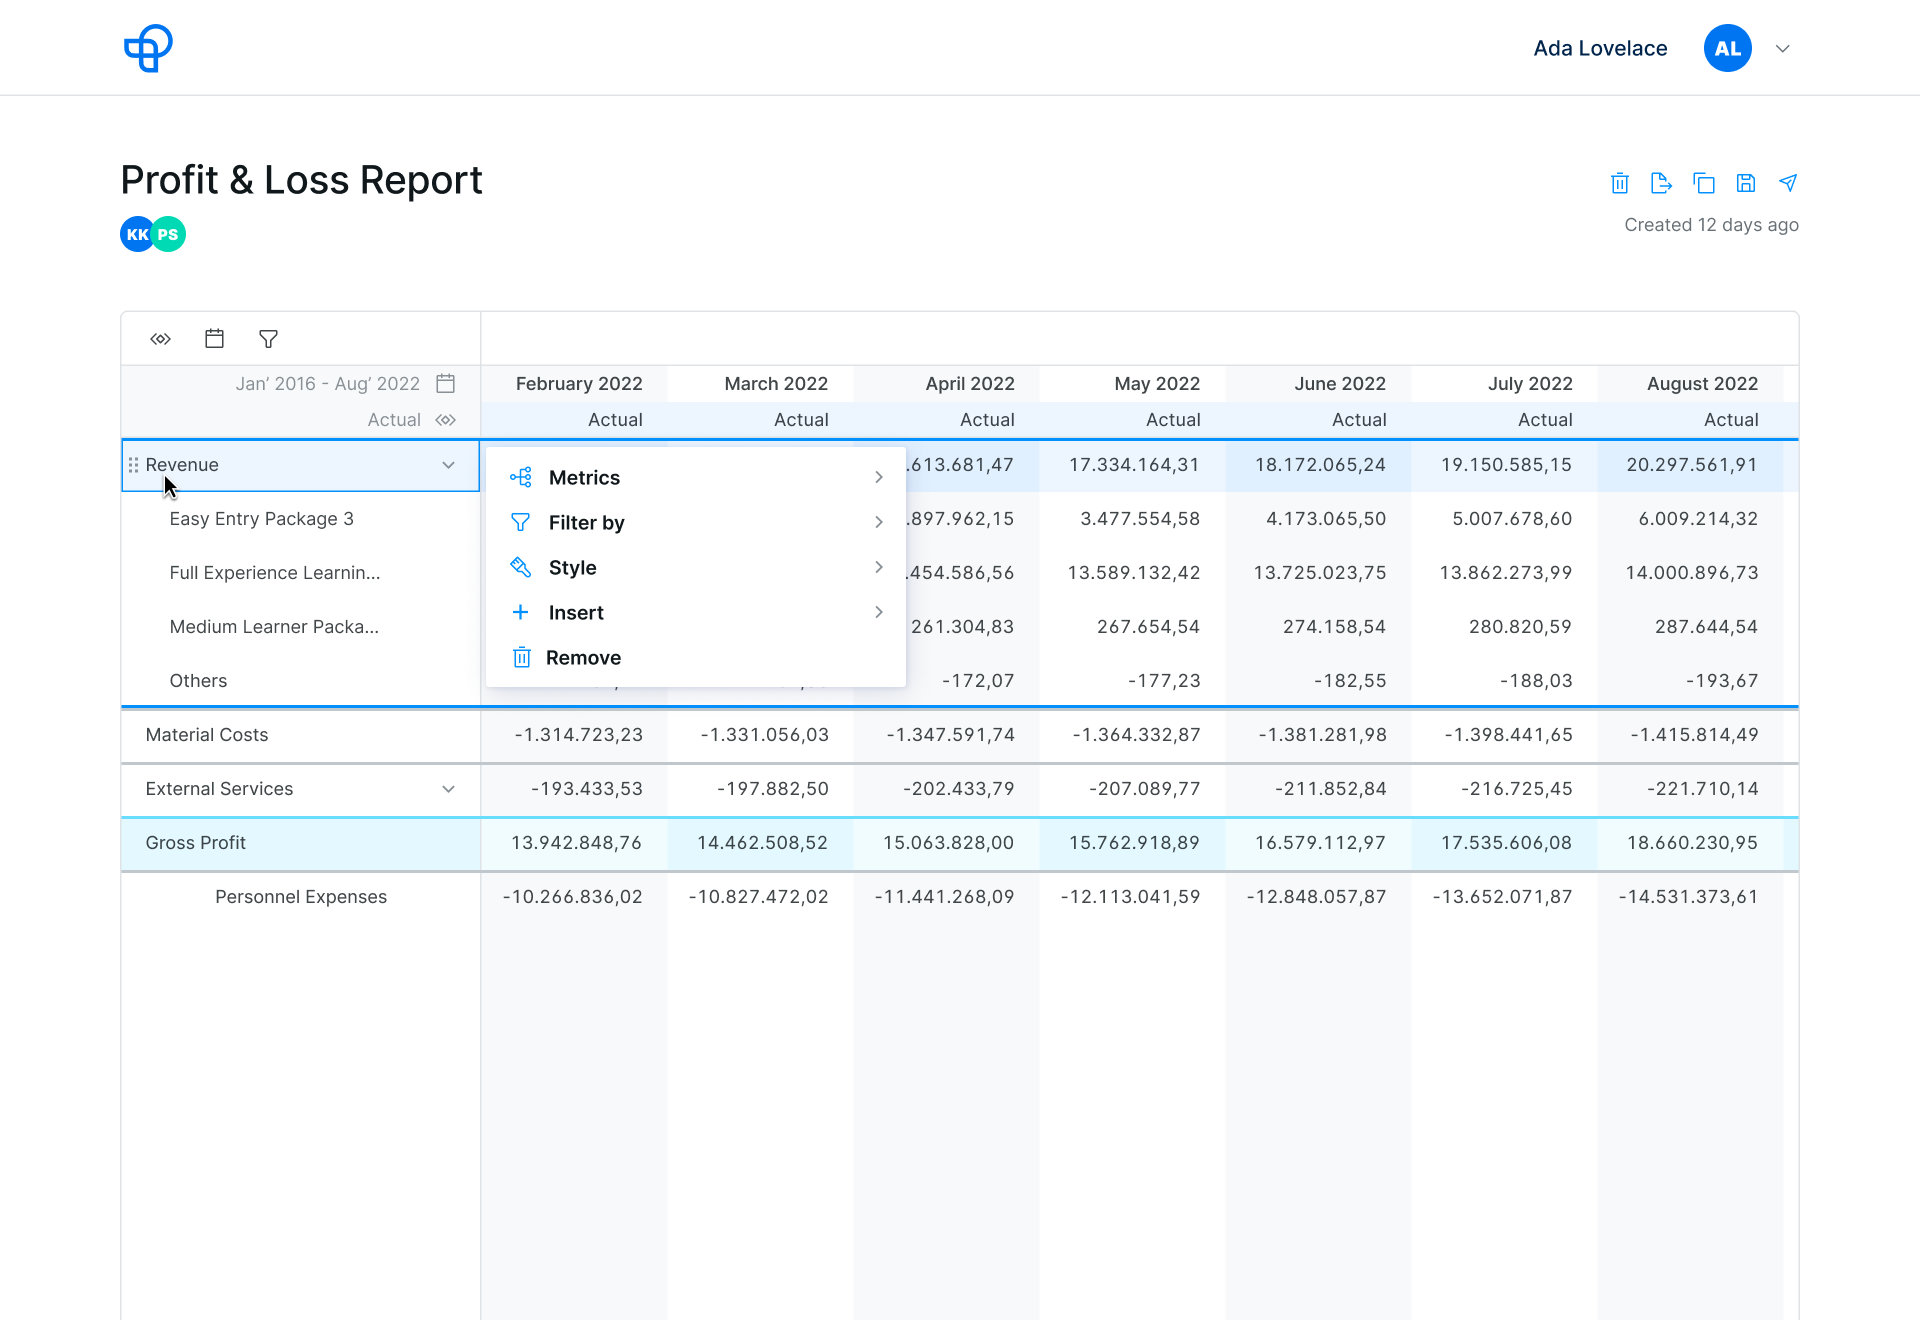
Develop
Involving engineers early and holding hand-off and design QA sessions, we were able to ship the first interactive version of the table.
In the process, I learned a ton! First and foremost I learned how a product team operates, to advocate for a user-centered culture and to make strategic decisions based on scope and business strategy.